A storm simulation can be run from Site3D using the storm simulation tool. After you have ran a storm simulation you can then see the simulation report and also play the simulation back within Site3D.
The storm simulation functionality in Site3D is built on top of the latest version of the EPA SWMM Engine. This industry-standard storm water modelling engine has been in use by other well-known drainage design software packages for decades. Due to the extensive global use of the SWMM engine the simulation is extremely well tested and you can have confidence in the generated results.
On the ![]() drainage auto-sizing-levelling and simulation toolbar,
click the
drainage auto-sizing-levelling and simulation toolbar,
click the ![]() Run Storm Simulation button.
Run Storm Simulation button.
After clicking on the Run Storm Simulation button you will see the following window appear:
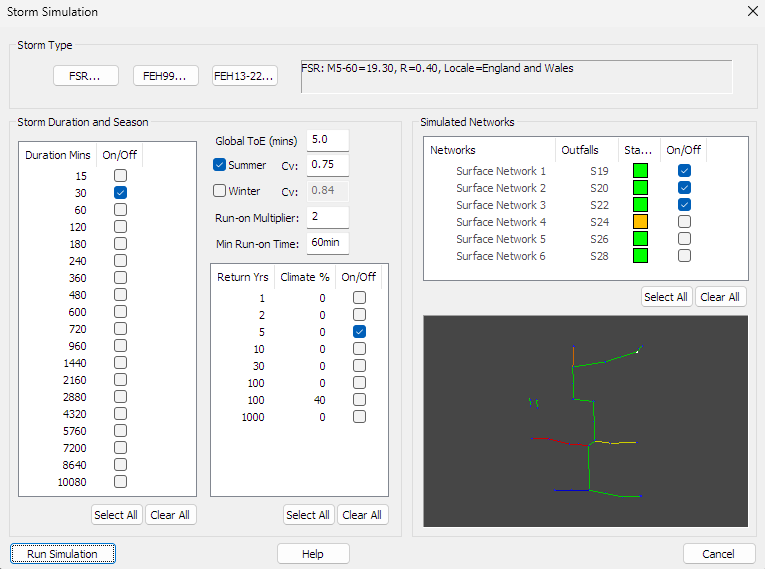
The area to the right shows the current rainfall parameters being used. You can click on one of the buttons to the left to pick new settings using data from either FSR, FEH99, FEH13, or FEH22.
Here you can pick any combinations of storm duration and return period to simulate. You can toggle multiple durations and returns by Shift or Ctrl clicking and then clicking the On/Off checkbox for one of the rows. Alternatively, you can toggle all the options using the Select All and Clear All buttons.
You can specify to simulate for the effects of climate change by specifying a percentage increase next to the storm return period. For example, you can specify to simulate a 100 year return period storm plus 40% climate change.
Note: You can change the default list of storms that is shown by editing the DrainageStormReturnPeriods setting in the Tools->Options facility.
You can set whether to simulate for summer or winter storm rainfall profiles, or both, and you can specify the runoff coefficient (Cv) to use. The runoff coefficient represents the proportion of water landing on a catchment area that ends up flowing into the drainage network. A Cv of 0.75 is often used for summer conditions and 0.84 for winter.
Note: Individual Cv values can be specified for each catchment area on the Drainable Area properties window. Individually specified Cv values will not be overridden by the Cv values specified on this Drainage Simulation window.
A global time of entry (ToE) can be specified. This represents the average time taken for rainfall to flow across the catchment areas before entering the drainage network. A typical ToE for urban areas is 5 minutes.
Note: Urban creep is also taken into account in the simulation if specified for any of the catchment areas. Urban creep is the anticipated additional impermeable area in the future due to residents paving over gardens and building extensions and so forth. The urban creep percentage, as well as the current percenage impermeable (PIMP) can be specified on each individual drainable area.
The last simulated combinations are saved per project.
There are settings for the Run-on Multiplier and the Min Run-on Time. These settings determine how long the simulation will run-on for after the end of the storm, and can be useful for ensuring the Half Drain-Down Time is readable from the exported graphs for ponds and tanks. These graphs can be found in the simulation results report. The run-on time is the maximum of the run-on multiplier or the min run-on time. The max run on time is 7 days.
Run-on Multiplier
The multiplier defaults to 2 which means each simulation will run twice as long as the duration of the storm. For example, a 12 hour storm will simulate for 24 hours. This value must be between 1 and 10 but, it is recomended to have this value below 5 to prevent long simulation times for longer duration storms.
Min Run-on Time
The minimum run-on time setting forces the simulation to run for the storm duration plus this value. This is useful to ensure storms run long enough to see the half-drain-down point. For example, to determine if the storage will half-drain-down within 24 hours, set the Min Run-on Time to 1440 (60 minutes x 24 hours), so that the drain-down graphs will definitely cover the 24 hour period after the storm.
The run-on time and multiplier are also saved on a per project basis.
Select which networks you want to run the simulation on. You can toggle multiple networks by Shift or Ctrl clicking and then clicking the On/Off checkbox for one of the rows. Alternatively, you can toggle all the networks using the Select All and Clear All buttons.
A network will show a green status icon if it is valid. If there is no outfall set on a network it will have a red status icon and can not be simulated. If the network does not have valid pipe numbers, which would indicate an issue with the network design, the network will have an orange status icon and can not be simulated.
As a result of discussions with LLFAs (Lead Local Flood Authorities), Site3D does not include a setting for additional storage per hectare or MADD Factor. Accordingly, the drainage simulation is done with 0.0m3/ha additional storage and a MADD Factor of zero.
Press the Run Simulation button to start the requested simulations. While the storms are being simulated a progress window is shown.
After clicking on the Run Simulation button you will see the following window appear:
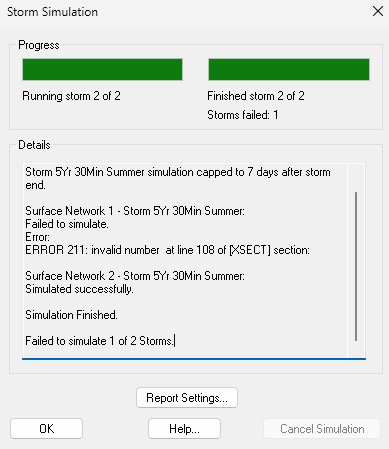
The simulation progress window is shown during storm simulations. The window displays the overall progress of the simulations showing the storms that are currently running and the number of storms that have finished. Any storms that fail to simulate will display their error message in the details section. Once all storms have finished, pressing the OK button will generate the results and close the progress window.
At any time during a simulation you can press the Cancel Simulation button to halt the simulation, this will cancel all queued storms. If a simulation is cancelled its results will not be displayed.
The simulation results are shown after running a storm simulation on a drainage network. The results are then stored in the network so you can safely close the results window and return to it later as long as the network remains unmodified.
Note: Changes made to the drainage network will invalidate any previously calculated simulation results for the modified network, because the simulated network will no longer match the drainage network in the model. In this situation the drainage simulations for the modified network will need to be run again.
To see any previously calculated simulation results report you can press the ![]() Simulation Results Report button and then select the network to view the simulation results for.
Simulation Results Report button and then select the network to view the simulation results for.
Click here for more in-depth information on the Storm Simulation Results Report.
After you have run a storm simulation on a network you can press the ![]() Simulation Playback button and then select the network to play back a simulation from the selected network.
Simulation Playback button and then select the network to play back a simulation from the selected network.
Click here for more in-depth information on the Simulation Playback.