When using the Flood Studies Report (FSR) method to calculate rainfall intensity profiles, you need to two values. These are the rainfall depth of an M5-60 storm, in mm, and ratio of the M5-60 to the M5-two day storm event (Ratio R).
On the ![]() drainage size and level tools click the
drainage size and level tools click the ![]() button.
button.
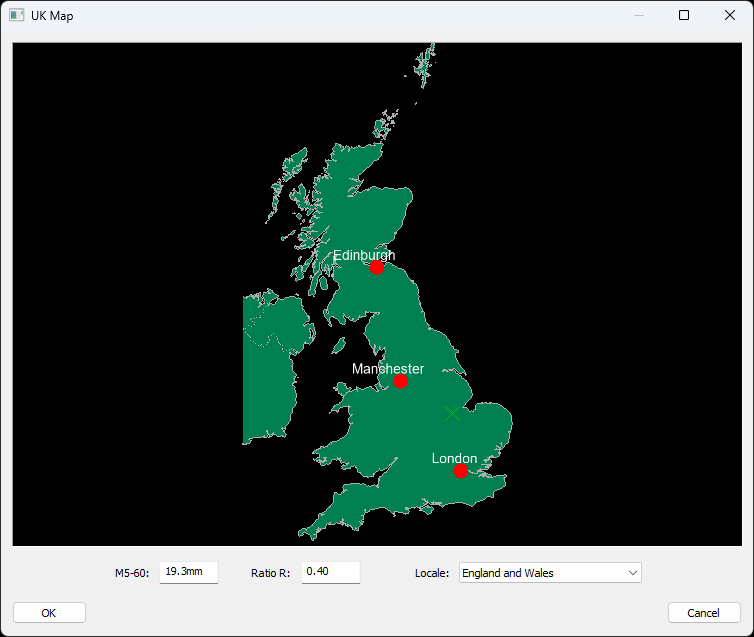
By default the map will show the site position based on the drawings site extents. You can overide this by clicking on the map. The corresponding M5-60 and Ratio R values are shown below the map.
You can zoom in and pan the map with the mouse:
Clicking the left mouse button to select the desired site location will show a green cross where you clicked for confirmation. The M5-60 and Ratio R values will automatically show in the edit boxes below the map.
To see more map detail, simply zoom in to the map using the scroll wheel and more place names will show on the screen, as indicated in the images below:
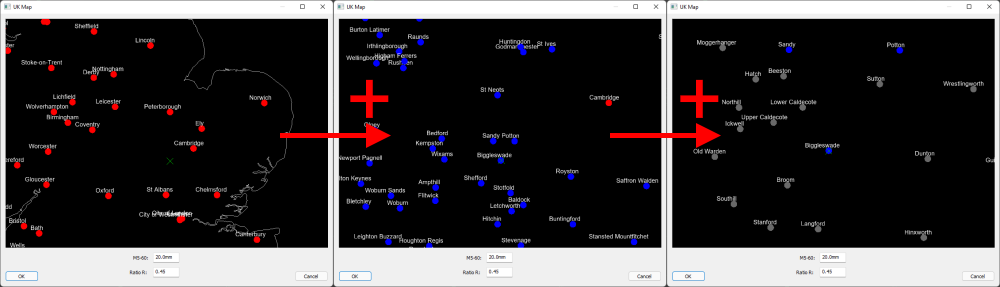
Placenames are colour coded:
Alternatively, if you know the values already, you can simply type the M5-60 and Ratio R values directly into the edit boxes below the map.
The M5-60 value is the expected depth of rainfall, in millimetres (mm), from a storm lasting 60 minutes with a return period of 5 years.
The dimensionless ratio "r" value is the M5-60 minutes value divided by the M5-2 days value.
Click the OK button to confirm the values shown, or press the Cancel button to close the window without making any changes.
If you manually click a new location on plan, the Reset Position to Site Extent button will appear at the bottom. If clicked, this will reset the position on the map to the current site position.