To access the tools for adding and modifying plot boundaries click the ![]() button in the main design toolbar.
button in the main design toolbar.
The plot boundary tools allow you to digitise boundary lines around garden plots and define levels at each point.
The level difference at the boundary determines if it is a fence, gravel board or retaining wall.
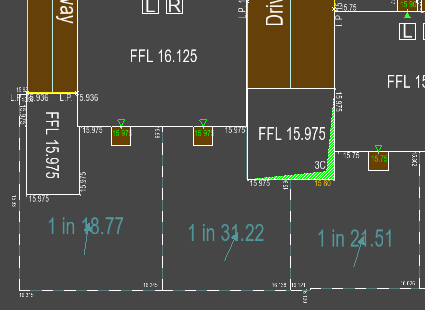
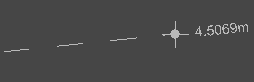
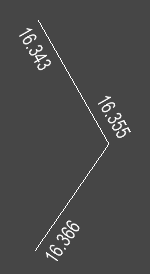
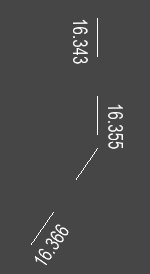
This example image shows plot boundaries separating the gardens of adjacent houses.
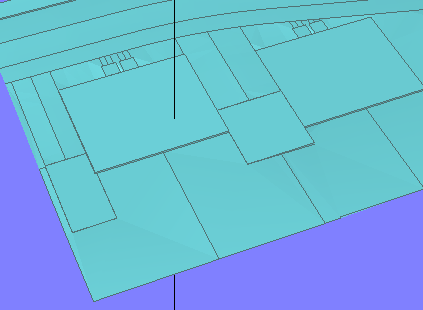
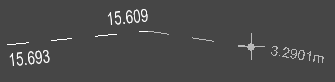
This image shows the resultant final surface for the site.
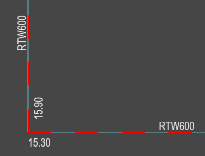
Below is an example showing a 0.6m level difference between the inner and outer edges of the boundary line, resulting in a retaining wall being annotated:
For Plot Boundary Tools, the following toolbar is shown on the top left of the plan view window:


Click one of the following tool links for more information:
View Long-section along a boundary
Using this tool you can define the position of the boundaries of the plots on your site.
After selecting this tool the mouse will be shown as a cross with a small dot underneath, indicating that you can click to place a new level point for a plot boundary.

After clicking once to place the start point, a dashed line will be drawn to the mouse cursor.
Click to add the indicated line to the drawing. You can then continue this process to place successive boundary lines.
An initial level is assigned at each point, taken from the current survey surface.
To stop placing new plot boundary points you can right-click and select Quit Command from the right click menu, or simply switch to a different tool.
From the right click menu you can also select the Enter Coordinate option. This will bring up a window where you can enter an exact coordinate to place a new point.
This tool allows you to insert a new point into one of the existing plot boundary lines, breaking it into two lines.
When you select this tool the nearest plot boundary line to the cursor will be highlighted as you move the mouse.
You can click to add a new point between the two points on either end of the line. Two lines will then be drawn to the cursor, indicating how the new point connects to the existing boundary. Click to place the new point in the desired position.
This tool allows you to move a plot boundary point.
When you select this tool the nearest plot boundary point to the cursor will be highlighted as you move the mouse.
Click to select a point, move it to the desired position and click to place it.
This tool allows you to delete a plot boundary point.
When you select this tool the nearest plot boundary point to the cursor will be highlighted as you move the mouse.
You can then click to delete the highlighted point.
After deleting a point, any other point that is left without a link to another point will also be deleted.
This tool allows you to delete a plot boundary line.
When you select this tool the nearest plot boundary line to the cursor will be highlighted as you move the mouse.
You can then click to delete the highlighted line.
After deleting a line, any point that is left without a link to another point will be deleted.
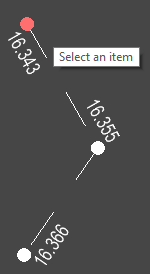
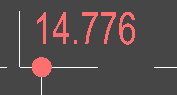
This tool allows you to set a level at a plot boundary point.
When you select this tool the nearest plot level to the cursor will be highlighted as you move the mouse, including the hidden levels.
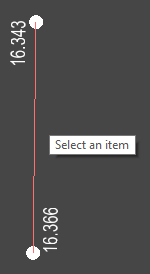
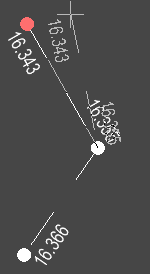
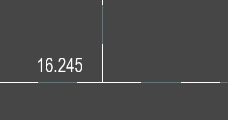
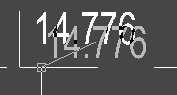
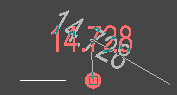
Note: When you create a new plot boundary all the levels at a boundary point will initially be the same. Because of this, only one of these levels is annotated to avoid over-crowding the drawing. When selecting level texts the hidden ones will also be selectable. This is shown below:
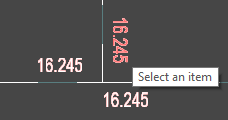
You can then click on a level text to set the level of the annotated point. This will bring up the following window:
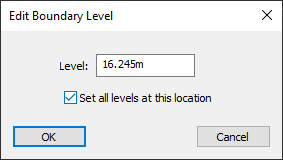
If Set all levels at this location is ticked this will set the all levels the same at this point, resulting in a single level annotation at the point. Otherwise this will set only the selected level at the highlighted text position. This allows you to have a different level either side of the boundary line.
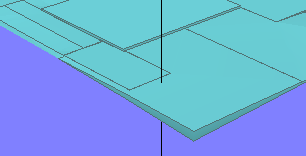
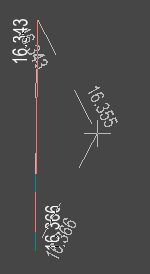
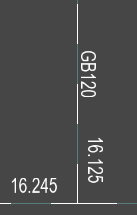
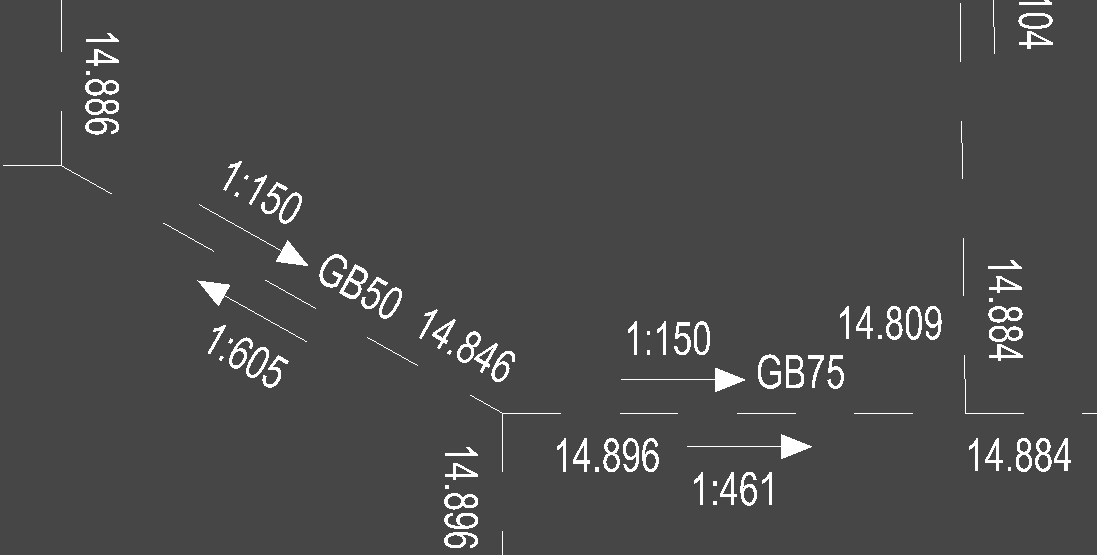
Setting different levels on opposite sides of a boundary line will automatically annotate the line as either a gravel board (GB) or retaining wall (RTW):
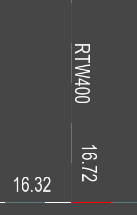
The level difference thresholds for gravel boards and retaining walls, as well as the annotation text format, can be set on the Plot Boundary Properties window
This tool allows you to move the text position of a plot boundary level annotation.
Select an annotation to move, the annotation closest to the cursor will be highlighted to show which annotation will be selected. After selecting an annotation, there will be a guide under the cursor showing the new location of the annotation text.
This tool allows you to rotate the text of a plot boundary level annotation.
Select an annotation to rotate, the annotation closest to the cursor will be highlighted to show which annotation will be selected. After selecting an annotation, there will be a guide under the cursor showing the new rotation of the annotation text.


This tool allows you to level a plot boundary edge by setting a gradient between two points.
When this tool is active the current gradient of each plot boundary edge will be displayed and the plot level nearest to the cursor will be highlighted as you move the mouse. Selecting a plot level works the same way as the Edit Levels tool.
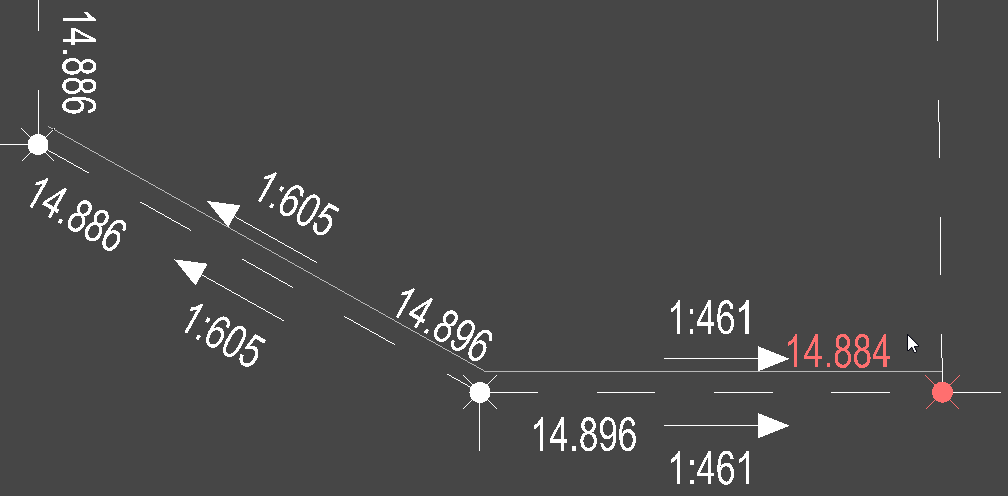
Click to select the first point which will be the starting point of the gradient re-levelling:
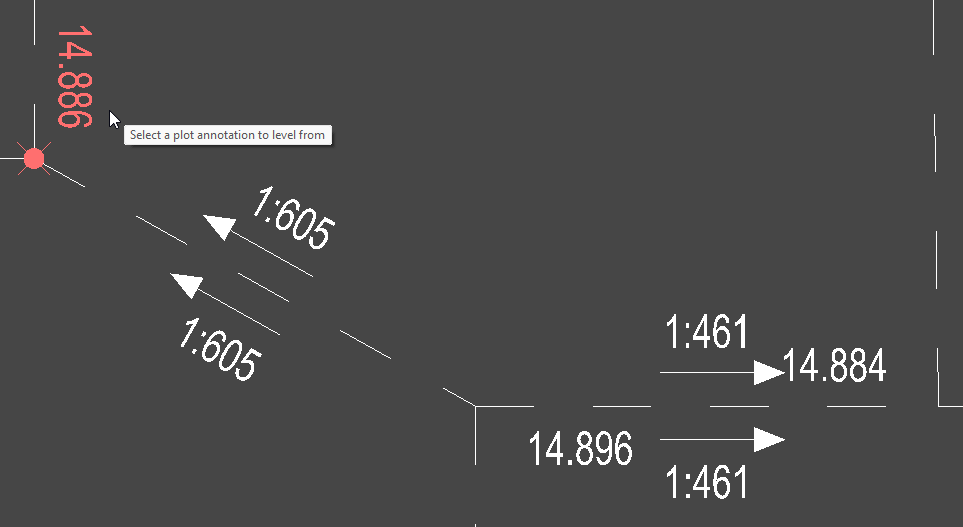
Then click on another plot level to select the final point for the gradient levelling. The two plot levels must be along the same edge. If the two points are connected you will see a line offset from the plot boundary indicating the edges that will be levelled:
 >
>
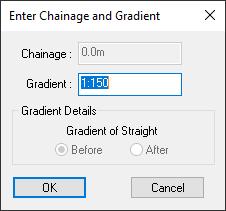
Picking both points will bring up the Enter Gradient window where you can specify the gradient you want between the selected points:
Below shows the result:
 >
>