This tool allows you to view simulation graphs of conduits, manholes and permeable paving, that have had a storm simulation ran on their network. To view graphs of ponds and tanks select the manhole it is assigned to.
On the ![]() Drainage Analysis toolbar, click the
Drainage Analysis toolbar, click the ![]() button.
button.
You then select the conduit, manhole or permeable paving to view. Click to select.
The simulation graph window is shown with a fully labelled depth-time graph:
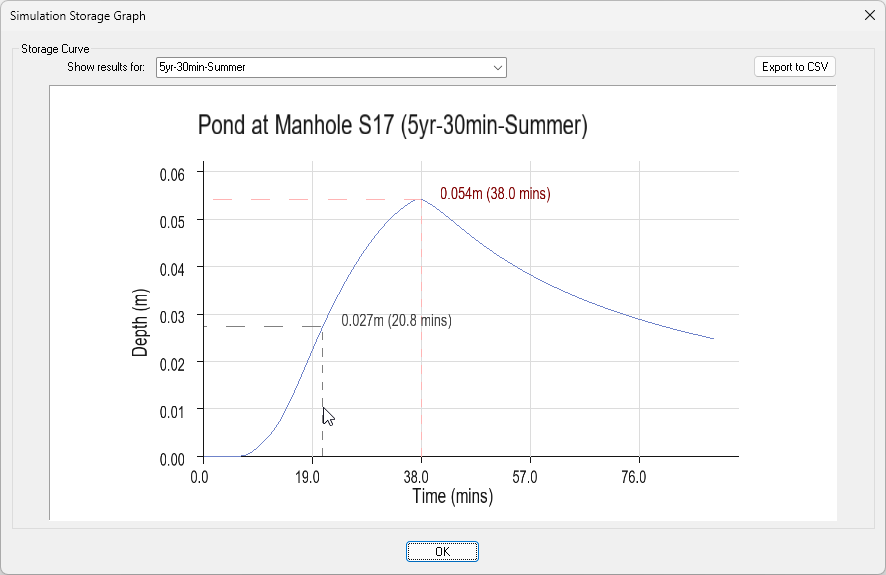
The graph illustrates the depth in the item across the duration of the selected storm simulation. By default the graph for the critical storm is shown. You can change the storm shown using the top dropdown, all the storms from the last run simulation will be displayed.
The highest depth will be drawn on in red along with the time the depth was recorded in brackets. You can also use your mouse to get depth-time information at a particular point by moving it over the graph to the point desired.
You can export the graph to a CSV file using the top right Export to CSV button, which once saved, can then be opened in external programs such as excel. The file will contain the depth for every minute of the simulation.