The longsection properties window allows you to adjust the contents and display settings of the longsection view.
While a longsection view window is active, click on the Section View Display Properties button (![]() ) from the view toolbar on the right edge of the window.
) from the view toolbar on the right edge of the window.
You should see the window below:
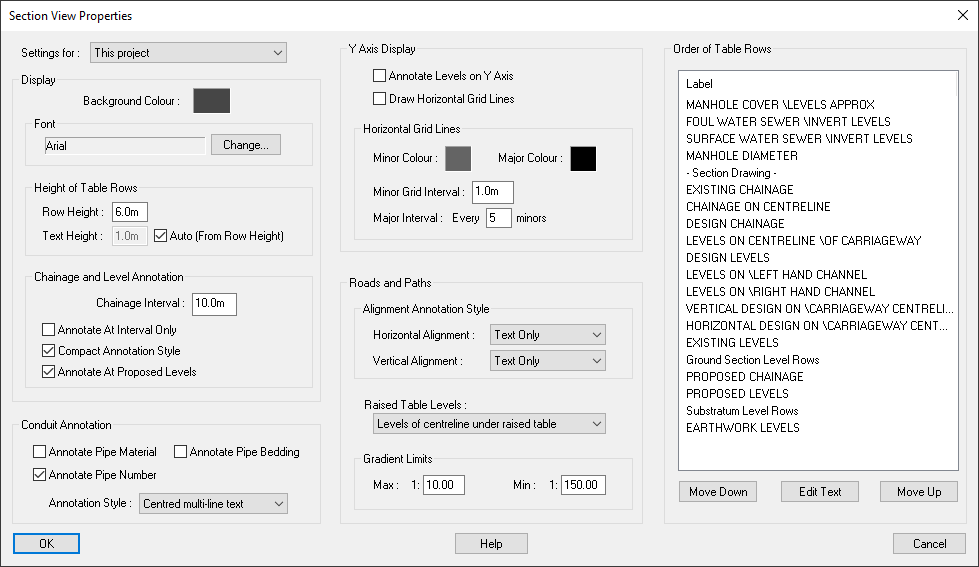
The current background colour is shown and can be modified by clicking on the colour block, a window will pop up allowing you to select one of the pre-set colour options or you can define your own custom colour choice.
The current font is shown and can be modified by clicking on the button displaying the current font, a window will pop up allowing you to select a font from the list of fonts that are installed on the system.
This specifies the height of the annotation boxes.
By default the text height is determined by the row height and the Auto box will be ticked. If you untick the auto box you can manually specify the text height.
This specifies the interval at which annotation values appear in the annotation boxes. The default is every 10 metres.
When ticked the table annotations only occurs at the specified interval. If un-ticked, vertical IPs and the vertical tangent points will also be annotated.
Regardless of the setting, annotation will always occur at the start and end points.
When ticked the chainage annotation neatly squeezes in as many values as possible in crowded regions. Text may be offset slightly to achieve the best fit, but tick marks indicate the true chainage position.
If un-ticked the chainage annotation will be drawn in a uniform style. However, in this annotation style you cannot fit as many text values in crowded regions.
| Compact Chainage On | 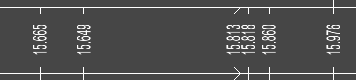 |
| Compact Chainage Off | 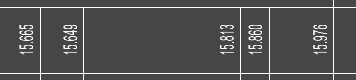 |
The longsection drawing shows the change immediately.
With this option ticked the chainage and levels of ground sections will only be annotated at the at the same points as the centreline/main design line.
When unticked the ground sections will be annotated at every change of surface gradient and breaklines on the surface.
You can enable or disable the annotation of pipe material, pipe bedding, and pipe number on the longsection. If these options are enabled they will be annotated with the rest of the pipe information in the drainage invert level rows.
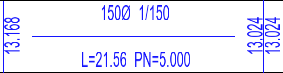
Below is an example of the conduit annotation with all of these options disabled:
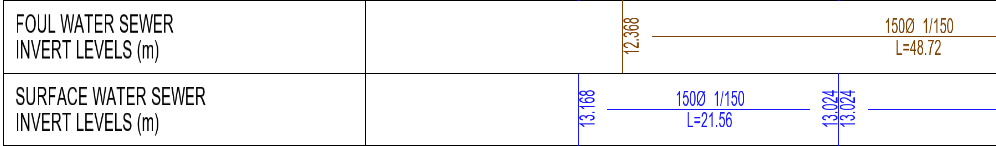
And here is an example with all of these options enabled:
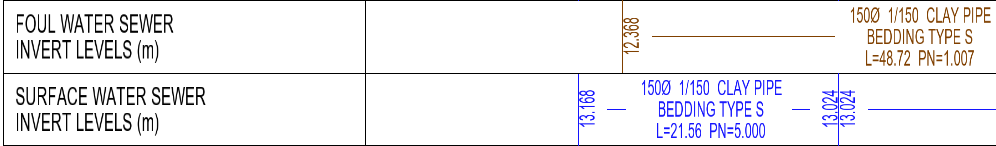
As shown above, displaying the pipe bedding will add an additional line of text and removes a portion of the line which would otherwise overlap the additional text.
Here you can pick either Centred multi-line text or Separate lines of text.
Centred multi-line text: With this option selected, pipe annotations will be drawn as a single vertically centred block of multi-line text. This style is shown in the above conduit annotation example images. When exported to CAD, these annotations will be exported as a single MText entity.
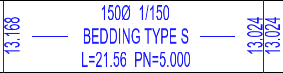
Separate lines of text: With this option selected, each line of the pipe annotation text will be drawn (and exported to CAD) as separate text entities with separate vertical alignment settings. Because of this, the top and bottom lines of text are vertically aligned to the edges of the annotation row. Below is an example of this in Site3D:
With the pipe bedding annotation enabled the two annotation styles produce very similar results. Shown below is an example of the separate lines of text style with pipe bedding annotation enabled:
Here you can set the Y axis annotation and grid line settings.
If Annotate Along Axis is ticked you will get level annotations along the axis at the specified interval, with level annotations every major interval.
If Draw Grid Lines is ticked then you will get horizontal lines drawn across the long section at the specified interval, with major interval lines highlighted.
There are text-boxes that allow you to specify the Minor Interval and how many minor intervals comprises a major interval.
The minor and major tick interval colours are shown and can be modified by clicking on the colour blocks. Clicking on one of the colour blocks will open a colour picker window where you can select a new colour.
Here you can specify how the horizontal and vertical alignment gets annotated.
No special annotation.
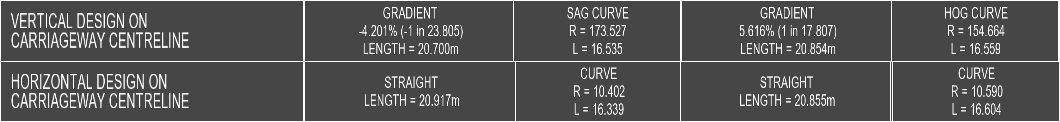
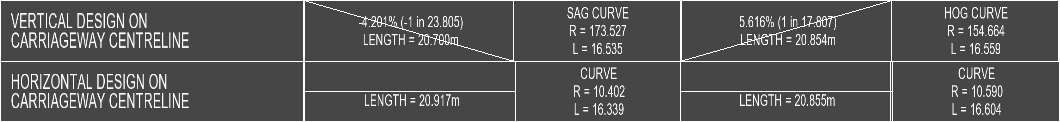
Vertical Alignment: Curves will be drawn to indicate either a hog or sag curve in the vertical alignment instead of text specifying the curve type.
Horizontal Alignment: Curves will be drawn to indicate the direction of a turn in the horizontal alignment instead of text specifying that there is a curve.
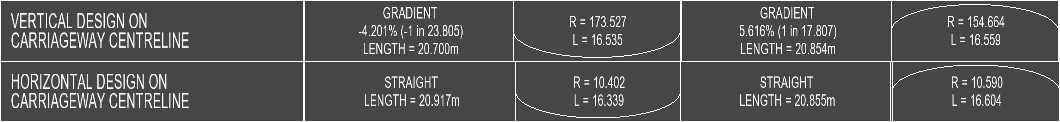
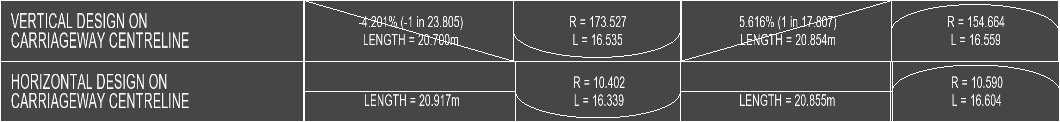
Vertical Alignment: Lines will be drawn to indicate the gradient direction instead of text specifying that it is a gradient.
Horizontal Alignment: Lines will be drawn to visually indicate each straight instead of text specifying that it is a straight.
Both curves and lines will be visually annotated as noted for the individual options above.
This option allows you to choose how the centreline and channel levels are annotated when the road has a speed table.
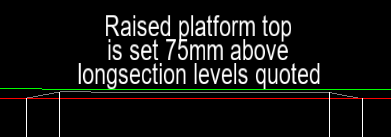
Levels of centreline under raised table: specifies that the annotated centreline/channel levels will match the underlying centreline/channel lines that are below any raised platforms. The longsection will automatically include an annotation on the section specifying that the raised platform levels are above the quoted centreline levels (shown in the image above). This option is useful when the raised platform is short and is more of an addition to the road construction.
Levels of raised table surface: specifies that the annotated centreline/channel levels match the top of the designed surface, be that road or raised speed table. This option is useful when the raised platform is longer, either partial or entire road length, and is designed as a shared surface.
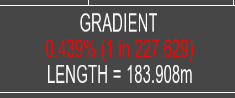
Here you can specify the minimum and maximum gradients that you want in your design.
If a gradient is outside of this design specification then it will be highlighted to you in red in the longsection annotation.
On the left of the window is a list of the longsection row labels. The labels appear in the order the corresponding rows are drawn in the longsection view, from top to bottom.
Rows can be quickly reordered using drag and drop functionality. This is done by clicking on an item, keeping the mouse button held down and dragging the row the desired position, then releasing the mouse button to drop the row to the new position.
You can also move rows up or down one row at a time, which will swap the row with the row above or below respectively. This is done by clicking on one of the rows and then clicking on one of buttons below the row list to move it up or down. Alternatively, you can right click on a row and select Move Up or Move Down from the right click menu.
The row titled "- Section Drawing -" indicates the position of the section drawing. Rows that come before this item in the row list will be drawn above the sections, while rows after this are drawn below the sections.
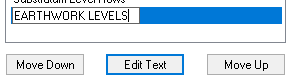
Row labels can be edited by clicking on a row and then clicking the Edit Text button below the row list, or by right clicking on a row and selecting Edit Label from the right click menu.
The selected item will change to a textbox that you can type into:
The following rows cannot be edited: Section Drawing, Ground Section Level Rows, Substratum Level Rows. This is because these are placeholder rows for additional content to be inserted and as such do not have their own labels. For example, the "Substratum Level Rows" controls the position that substratum rows are added, but there may no substratum rows or multiple substratum rows, and the individual substratum rows will use the corresponding substratum name as the row label.